SDO Science
SDO is helping us to understand the how and why of the Sun's magnetic changes. It will determine how the magnetic field is generated and structured, and how the stored magnetic energy is released into the heliosphere and geospace. SDO data and analysis will also help us develop the ability to predict the solar variations that influence life on Earth and humanity's technological systems.
SDO measures the properties of the Sun and solar activity. There are few types of measurements but many of them will be taken. For example, the surface velocity is measured by HMI. This data can be used for many different studies. One is the surface rotation rate, which must be removed to study the others. After subtracting the rotation, you have the oscillation and convective velocities. The latter look like billows of storm clouds covering the Sun. Hot gas moves outward at the center of the billows and downward at the edges, just like boiling water. By looking at these velocities you can see how sunspots affect the convection zone. By looking at a long sequence of data (more than 30 days), you see the oscillations of the Sun (like the picture). These patterns can be used to look into and through the Sun.
Mission Science Objectives
The scientific goals of the SDO Project are to improve our understanding of seven science questions:
- What mechanisms drive the quasi-periodic 11-year cycle of solar activity?
- How is active region magnetic flux synthesized, concentrated, and dispersed across the solar surface?
- How does magnetic reconnection on small scales reorganize the large-scale field topology and current systems and how significant is it in heating the corona and accelerating the solar wind?
- Where do the observed variations in the Sun's EUV spectral irradiance arise, and how do they relate to the magnetic activity cycles?
- What magnetic field configurations lead to the CMEs, filament eruptions, and flares that produce energetic particles and radiation?
- Can the structure and dynamics of the solar wind near Earth be determined from the magnetic field configuration and atmospheric structure near the solar surface?
- When will activity occur, and is it possible to make accurate and reliable forecasts of space weather and climate?
It is widely believed that the Sun's magnetic field is generated by electrical currents acting as a magnetic dynamo inside the Sun. These electrical currents are generated by the flow of hot, ionized gases in the Sun's convection zone.
We know a lot about the Sun's magnetic dynamo. It has a 22 year cycle. During the first half of the cycle, the Sun's magnetic north pole is in the northern hemisphere while the magnetic south pole is in the southern hemisphere. Right around the peak of the sunspot cycle (solar maximum), the magnetic poles flip or exchange places so that magnetic north is now located in the southern hemisphere. This flip occurs about every 11 years at solar maximum.
The 22 year magnetic cycle greatly influences the most prominent manifestation of the dynamo, sunspots and active regions, which migrate towards the solar equator from high latitudes over the course of the solar 11 year "sunspot cycle". Sunspots and Active Regions are manifestation of the magnetic field generated in the Sun's interior poking through the visible region of the atmosphere. Active regions are responsible for the production of intense and violent energy burst, called flares, and events where very large amounts of hot gas, trapped by the magnetic field of the active region, are released from the Sun's atmosphere and into space, called coronal mass ejections (CMEs).
Prediction
What will the Sun and solar activity look like tomorrow? Next year? As we depend more and more on satellites for our everyday life, we also depend on keeping those satellites safe from the effects of solar activity (Space Weather). Much progress has been made in improving our ability to forecast solar flares and CMEs, but what about the level of solar activity next year?
| Activity | Prediction Type | Prediction Time |
|---|---|---|
| Flares | Probability of occurence, location | Today, tomorrow, next week |
| CMEs | Probability of occurence, location, geoeffectiveness | Today, tomorrow, next week |
| Active region emergence and growth | Location of emergence, rate of growth | Today, next month |
| Convection zone dynamics | Amplitude in future solar cycles | Decades |
Images from AIA will provide the information to look for changes in coronal loops that preceed flares and CMEs. The pace and resolution of these images should allow the reaarangement of magentic loops that cause flares to be seen. By looking at all of the Sun all of the time AIA will see whether changes in one part of the Sun cause changes in remote areas.
Evolution
Because the solar irradiance is the most important source of energy to the Earth, changes in that irradiance can change our climate and the satellites around the Earth. Increases in the solar irradiance changes can come from two places, the Sun getting hotter or bigger. Sunspots are cooler than average and cause TSI to decrease, faculae are hotter than average and cause TSI to increase. Increases in the size of coronal loops increases the EUV irradiance. It is not currently known if changes in the size of the Sun affect TSI.
If the size of the Sun could change, it would be a reaction to the way heat moves through the convection zone. Historical measurements of the size of the Sun have not answered this question. Helioseismology measurements from HMI will allow us to see into the convection zone and measure the properties of the convection zone. Combined with large models of convection, we can determine how a watched Sun boils!
Understanding the Solar Cycle
 The solar cycle is a rhythmic waxing and waning of the number of sunspots on the Sun. There are about 11 years between the times when the sunspot number is the greatest. We now know that the solar cycle is actually a magnetic cycle where the Sun's magnetic poles reverse with a periodicity of approximately 22 years containing 2 sunspot cycles. Sunspots and active regions are seen on the surface of the Sun. Arching above them are coronal loops, magnetic field lines traced by the hot gas moving along the field. Many of the observed properties of the corona and solar wind come from the magnetic field. The heating of the material in the corona and the acceleration of the solar wind are probably caused by the interaction of small-scale magnetic elements. Solar flares and CMEs occur when magnetic fields in these loops are stressed beyond their limits. With the exception of the slow evolutionary changes in solar structure over the last 4.5 billion years, all solar variability is magnetic in origin.
Solar Irradiance
The primary source of energy to the Earth is radiant energy from the Sun. This radiant energy is measured and reported as the solar irradiance. When all of the radiation is measured it is called the Total Solar Irradiance (TSI); when measured as a function of wavelength it is the spectral irradiance. Light of different wavelengths reaches different parts of the Earth's atmosphere. Visible light and infrared radiation reach the surface, warming the surface to livable conditions. Ultraviolet radiation in the UV-A, B, and C wavelengths is absorbed at higher and higher altitudes. Extreme ultraviolet and soft X-ray radiation (wavelengths less than 120 nm, EUV) is absorbed by the atmosphere above 100 km (60 miles). Although it is completely absorbed by our atmosphere, EUV radiation is quite dangerous to people and electronics in space.
Each part of the solar irradiance changes over the 11-year solar cycle, becoming brighter than average at solar maximum and dimmer at solar minimum. Each wavelength also changes as the Sun rotates and during solar flares. Changes seen at the Earth are not the same as those at the other planets.
To understand the mechanisms that cause EUV irradiance variations, two sets of measurements are required. Measurements of the EUV spectral irradiance over a wide range of wavelengths at a rapid cadence. Next, images of the Sun at the same wavelengths to identify the sources of the radiation. The EVE and AIA instruments will provide these complementary measurements.
Our Sun, a Weather Maker
Energy leaves the Sun as photons, energetic particles, and magnetic fields. Each has a measurable impact on Earth or near-Earth space. Photons move in a straight line from the Sun to the Earth, while other types of energy must follow a tortuous path through the Sun's atmosphere, the heliosphere, and the Earth's magnetosphere to reach the Earth's atmosphere. We will concentrate on the photons that move energy from the Sun to the Earth.
The Sun is a variable magnetic star. An astronomer would say the Sun's variations are typical for a Sun-like star. However, to a planet that seems to grow smaller each year, and a human population that is becoming increasingly reliant on technology, the Sun's variations are significant and dramatic. Changes in the Sun's magnetic field cause all of the variations that impact our life and technology here on Earth.
The science of SDO and LWS involves a complete understanding of the nature and manifestations of the Sun's energy. SDO's investigations are designed to understand the source of the Sun's energy, and how that energy is stored and released by the layers of the Sun's atmosphere. One part of that research is how the changes in the solar irradiance, or photon output, are produced.
Even subtle changes in irradiance can have a dramatic impact on the Earth's climate, atmosphere and ionosphere. Images at different wavelengths can be used to understand changes in the irradiance, but accurate measurements of the solar irradiance at a very rapid cadence are needed to truly understand the energetic input to Earth. Solar Irradiance on SDO
Extreme Ultraviolet Variability Experiment (EVE) investigation will measure the solar spectral irradiance at Extreme Ultraviolet (EUV) wavelengths from 1 to 1050 Angstrom (0.1 to 105 nm) plus the important hydrogen emission line at 1215 Angstrom. The EUV irradiance is absorbed by the atmosphere at altitudes above 100 km. This means changes in the EUV irradiance affect the thermosphere, ionosphere, and near-Earth space.
At left is a spectrum from the SEE instrument on the TIMED spacecraft, modified to show the EVE wavelength sampling. Data from SEE has shown that a daily value of the EUV irradiance is not enough to model the thermosphere and ionosphere. EVE will provide the solar data needed to drive the next generation of thermosphere/ionosphere models.
Measuring the EUV irradiance can be as easy as measuring the photocurrent from a piece of metal exposed to the Sun in space. This photoelectric effect won Einstein the Nobel Prize in 1921. EVE will use gratings to disperse the spectrum onto specially prepared CCDs to measure the irradiance with an accuracy of 5%.
What is Solar Irradiance?
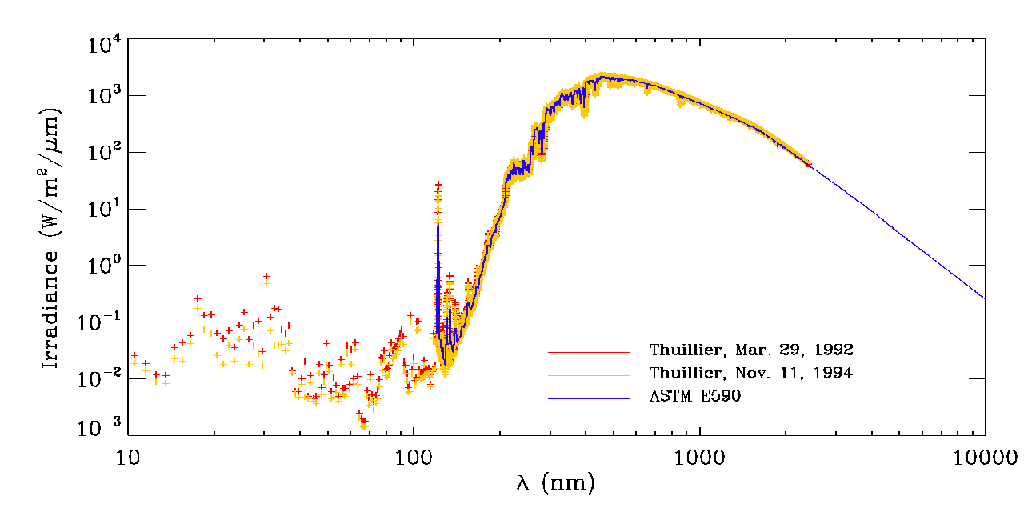
Three models of the solar spectral irradiance. All are based on measurements, but the infrared extension is a model assuming an almost black-body spectrum. Both axes are logarithmic, allowing the small irradiance at short wavelengths to be displayed with the much brighter visible light. The spectral irradiance changes by almost a million while the wavelength changes by by 1000!
Irradiance is the amount of light energy from one thing hitting a square meter of another each second. Photons that carry this energy have wavelengths from energetic X-rays and gamma rays to visible light to the infrared and radio. It can be measured for any glowing object, including stars, the Moon, and the overly bright high beams of an oncoming car. Human beings radiate primarily infrared light; an infrared image of a human shows a very active heart and mind!
The solar irradiance is the output of light energy from the entire disk of the Sun, measured at the Earth. It is looking at the Sun as we would a star rather than as a image.
The solar spectral irradiance is a measure of the brightness of the entire Sun at a wavelength of light. Important spectral irradiance variations are seen in many wavelengths, from the visible and IR, through the UV, to EUV and X-ray. As we look at the solar irradiance we should remember that space weather is related to ionization, while climate is related to absorption of heat.
Measuring the spectral irradiance is important because different wavelengths (or colors) of sunlight are absorbed in different parts of our atmosphere. We feel warm because of the visible and infrared radiation that reaches the surface. Ultraviolet light creates the ozone layer and is then absorbed by that ozone. Higher still ultraviolet light creates the thermosphere, which is ionized by light at the short wavelengths of the extreme ultraviolet (EUV). Because radio communications are affected by the created ions, changes in the solar EUV output are a primary Space Weather concern.
Energy from other sources also enters our atmosphere. A table of some of them is shown below. Note that the energy input from Joule heating, a coupling of the ionosphere to the magnetosphere, can be about the same as from solar EUV!
Sources of Energy for the Earth's Atmosphere
| Source: Solar Radiation | Energy Flux | Solar Cycle Change | Deposition Altitude | Ion? | |
|---|---|---|---|---|---|
| TSI (mostly Visible & Infrared) | 1366 W/m2 | 1.2 W/m2 | 0.1% | Surface | Low |
| MUV (200-300 nm) | 15.4 W/m2 | 0.17 W/m2 | 1% | 15-50 km | Low |
| FUV (126-200 nm) | 50 mW/m2 | 15 mW/m2 | 30% | 30-120 km | Mod. |
| EUV (0-125 nm) | 10 mW/m2 | 10 mW/m2 | 100% | 80-250 km | High |
| Source: Particles | Energy Flux | Solar Cycle Change | Deposition Altitude | Ion? | |
|---|---|---|---|---|---|
| Galactic Cosmic Rays | 0.7 µW/m2 | 0.7 µW/m2 | 50% | 0-30 km | High |
| Solar Protons | 2 mW/m2 | 2 mW/m2 | 100% | 30-90 km | High |
| Auroral protons & electrons | 1 mW/m2 | 20 mW/m2 | 100-120 km | Mod. | |
| Joule Heating | 20 mW/m2 | 2 W/m2 | 100-150 km | Mod. | |
We can easily see from the table that the Total Solar Irradiance (TSI) is the main contributor of energy to Earth. We are fortunate that visible and IR light, which contribute the majority of energy to Earth, exhibit the smallest relative variation. But, although TSI varies by only a fraction of a percent, it has the greatest magnitude of change (~1.2 W/m2). This may be enough to cause observable changes at Earth.
Three models of the solar spectral irradiance. All are based on measurements, but the infrared extension is a model assuming an almost black-body spectrum. Both axes are logarithmic, allowing the small irradiance at short wavelengths to be displayed with the much brighter visible light. The spectral irradiance changes by almost a million while the wavelength changes by by 1000!
Timescales and Degrees of Solar Variability

This data comes from the GOES 12 weather satellite. Each GOES satellite carries a number of Space Weather instruments. Their data is available from NOAA’S SEC in Boulder, Colorado.
The solar spectral irradiance constantly changes at all wavelengths and over different periods of time. All wavelengths change over the 11 years of a sunspot cycle. Flares cause the most rapid changes, increasing the X-ray irradiance in a few seconds. Fluctuations in TSI are associated with the five-minute oscillations of the Sun, although the effects of a flare have been measured by the SORCE satellite. Watching many wavelengths over many years is how we can understand how these variations are created. Watching from space is necesary to see all of the wavelengths (some are absorbed by our atmosphere).
The absorption of solar irradiance by the Earth is linked to many important processes. However, this absorption makes it difficult to accurately detect the total incident energy; an instrument on the ground can only detect the total energy minus the energy that has been absorbed!
Many Space Weather effects are caused by irradiance variations in the ultraviolet part of the spectrum. A solar flare can increase the X-ray irradiance 10 to 100 times for several minutes. The effects at Earth are dependent on wavelength and timescale. Here is an example of how a large flare changes the solar irradiance.
This data comes from the SEE instrument on the TIMED satellite. The data is available from the SEE website at LASP in Boulder, Colorado.
During October and November 2003 the Sun had many spectacular flares. A lot of them came from active regions 484 and 486. Here is a record of the X-ray irradiance just before and during the largest of those flares at 1929 UT on November 4, 2003. This may have been the brightest flare ever recorded! Active region 486 then rotates out of view only to return two weeks after for more fireworks.
The X-ray irradiance increased almost 10,000 times during the flare! The only flare thought to be larger was seen in 1853 and caused problems with the telegraph lines in the United States and Europe. A direct comparison is difficult as we no longer have an extensive telegraph network. Heck, we don't even have telegrams any more!
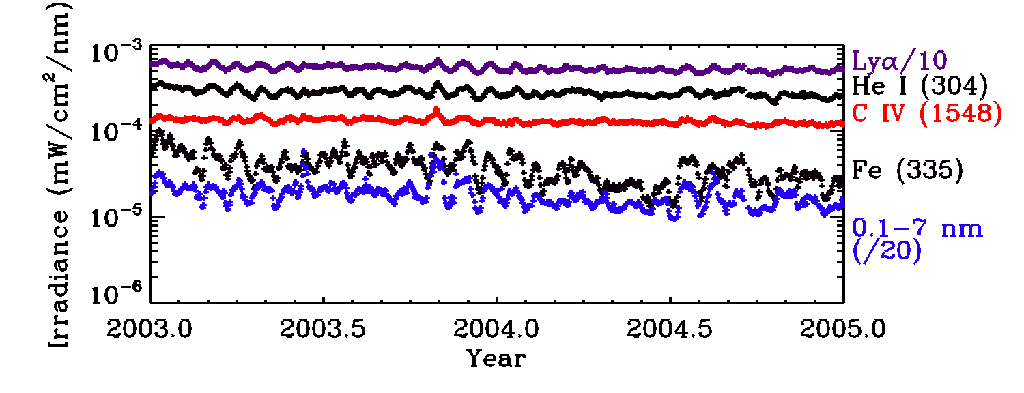
We also see changes in the solar irradiance over longer periods of time. The SEE instrument was launched on TIMED and has returned spectral irradiance data since early 2002.
During 2003 and 2005 the Sun was in the declining phase of Solar Cycle 23. The SEE instrument measured the spectral irradiance over the period, which included the Halloween Superstorm. Here we show the spectral irradiance at 5 different wavelengths during the two year period. The bottom two curves are far more variable (move up and down more) than the top three curves. Because these data are averaged over a day the flares seen above don't appear. Although the X-ray and EUV irradiances change by large amounts over a solar cycle the TSI varies by only a small amount.

Total Solar Irradiance and the Solar Cycle - Data from this figure is from composite_d41_61_0604.dat, provided by the PMOD/WRC, Davos, Switzerland, using unpublished data from the VIRGO Experiment on the cooperative ESA/NASA Mission SoHO mission. The data is described in C. Fröohlich and J. Lean, 1998, The Suns Total Irradiance: Cycles, Trends and Related Climate Change Uncertainties since 1978, Geophys. Res. Let., 25, 4377-4380, 1998.
Solar cycle variations in TSI can be clearly seen in the upper plot showing a composite of more than 25 years of satellite measurements. The red points are daily values while the green line is the annual average. Note how the changes over a day easily exceed the typical amount of variation over the solar cycle. The daily points vary by 0.3% while the annual points vary by only 0.07% (shown by the vertical lines at the left.) The annual sunspot is shown in the lower plot. Comparing the plots shows that TSI increases when solar activity increases.
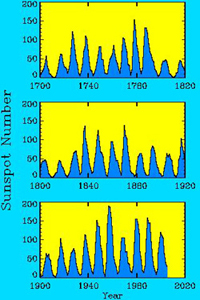
Accurate measurements of the solar irradiance must be made from satellites. These have been available for the past few solar cycles. Before that, we have only the sunspot number observations to use as a proxy of solar irradiance. We have records of sunspots since Galileo started sketching the surface of the Sun in the early 1600's. Some observers did better than others, but the 400 year record of sunspots is a rare long-term dataset in science. These observations show that the sunspot cycle has persisted over the past few hundred years and that more dramatic variations were seen in the past. We even find a period when sunspots were few and the Earth was cold—the Maunder Minimum (1645-1710). This is not due to lack of looking. Scientists tried to see sunspots during the Maunder Minimum and did not. Noticing that TSI is higher at solar maximum, perhaps the lack of spots tells us what caused the cooler temperatures.

Sunspot Number Over the Centuries - The sunspot number has been measured since 1610.
The period of low sunspot number in the mid to late 1600's is called the Maunder Minimum. We can extend the record further back in time by measuring isotopes of carbon and beryllium that are produced by cosmic rays. During solar maximum it is more difficult for cosmic rays to reach the Earth than at solar minimum, causing a solar cycle to appear in the isotope data.
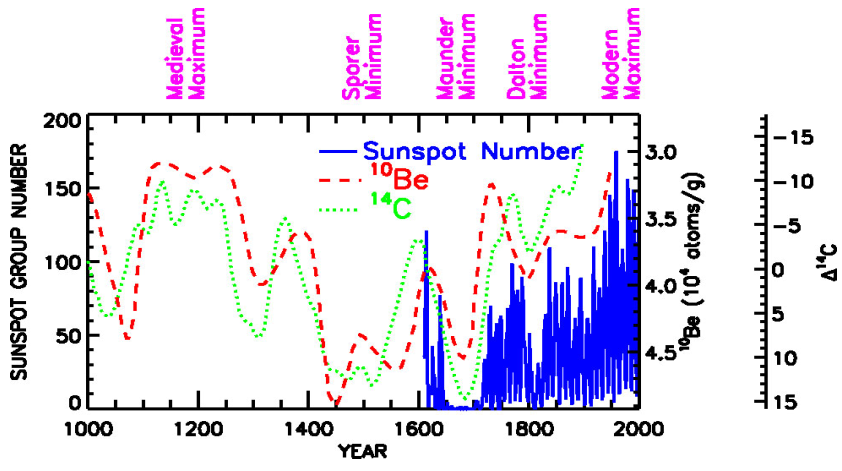
Sunspot Number Over the Centuries
These cosmogenic isotopes, which are found in tree rings and ice cores, are solar activity proxies that suggest long-term fluctuations in solar activity may exceed the range of contemporary cycles. In this figure minimum and maximum refer to surface temperature. The Maunder Minimum is labelled, along with several other temperature extremes. There is a tendency for cooler temperatures during times when the Sun is less active.
The changes in isotopes are tracked fairly well by the temperature measurements from other records?
Looking further back in time, we find that the Sun has increased in brightness about 25% since its birth 4.5 billion years ago. How did the Earth's atmosphere and the changing solar brightness interact to create a livable climate over the past billion years?
Some important points:
- At every wavelength the solar spectral irradiance changes over the 11-year sunspot cycle.
- The sunspot cycle also varies in time, and there is evidence of significantly different behavior in the past
- All types of energy input to Earth exhibit greater changes on shorter timescales (flares, CMEs)
Effects of Solar Irradiance Variability
Absorption Altitude - The altitude where solar radiation reaches in the Earth's atmosphere. Red areas receive full sunlight, black areas see none at that wavelength.
Solar irradiance between 122 and 200 nm (FUV wavelengths) creates the atomic oxygen that flows up to form the thermosphere and the ozone that forms the ozone layer. Changes in the FUV irradiance are smaller than those in EUV wavelengths. Solar Cycle Changes at 700 km: Neutral Temperature: 2 times; Neutral Density: 50 times; Electron Density: 100 times.

Temperature Change - The change in temperature of the outer layer of the Earth's atmosphere caused by the Sun (labeled F10.7) and the geomagnetic activity of the Earth (labeled Ap) in the Jacchia model. The F10.7 variation is much larger than Ap. When the temperature is higher the atmosphere expands. This increases satellite drag.
Living With a Star research will allow us to build accurate, data-assimilation models of the thermosphere and ionosphere. Users of space weather data would like a picture of today’s ionosphere to allow them to anticipate radio outages and GPS navigation errors.
Higher density & temperature leads to more drag. Higher electron density leads to more interference with radio communications.
What Causes Irradiance Variations?
Current scientific models of the solar dynamo can be adjusted to reproduce the 11-year solar cycle. Longer periodicities may be predicted by the models, but at this stage the models are not sufficient to reproduce all of the changes observed in the solar cycle. The solar dynamo generates the magnetic field that causes the solar cycle (also called the 22-year solar cycle, the 11-year sunspot cycle, or the magnetic cycle).
Some important questions about the source of irradiance variations:
- What changes in the Sun cause irradiance variations?
- What measurements and models are required to determine and predict irradiance variations (e.g., magnetic field measurements, solar interior models)?
- How does the spectral irradiance vary from one wavelength to another? (We need this information because irradiance variations at different wavelengths can have different impacts at Earth).
- Can we understand the variations in irradiance on all relevant timescales, from the seconds of solar flares to centuries?
A longitudinal magnetogram from the MDI instrument on SoHO on October 30, 2001. White regions have an outward (Northern) polarity while black regions are an inward (Southern) polarity. The tilts are due to the differential rotation of the Sun.
All of these changes in solar irradiance are linked to changes in the solar magnetic field. Even the smallest magnetic features can have an observable connection to the irradiance output. The magnetic field is generated in the solar interior. Therefore, to fully understand the mechanisms which cause irradiance variations, we require:
- Measurements of irradiance over a broad range of wavelengths representing a wide range of energies (EVE)
- Images of the variation in radiance among the different magnetic features (AIA)
- An understanding of how magnetic fields are created and change (AIA & HMI)
- Measurements of the origin of the energy (HMI)