SDO & Space Weather
SDO will measure the irradiance of the Sun that produces the ionosphere. It will also measure the sources of that radiation and how they evolve.
Charged particles are created in our atmosphere by the intense X-rays produced by a solar flare. The solar wind, a continuous stream of plasma (charged particles), leaves the Sun and fills the solar system with charged particles and magnetic field. There are times when the Sun also releases billions of tons of plasma in what are called coronal mass ejections. When these enormous clouds of material or bright flashes of X-rays hit the Earth they change the upper atmosphere. It is changes like these that make space weather interesting.
Our Sun, a Weather Maker

Everyone knows (or at least complains) about the weather at the surface of the Earth. Water vapor condenses into clouds, falls to the ground, and flows to the oceans; only to be evaporated back into the atmosphere by solar radiation to complete the cycle. Space weather refers to changes in the magnetosphere, ionosphere, and thermosphere that can affect our technological systems and can endanger human life or health. These changes start at the Sun and move to the Earth. Creating, moving, and destroying charged particles is the cycle of Space Weather.
WHAT IS SPACE WEATHER?
Our Sun is an extremely active star. Solar activity expels radiation and atomic particles from the Sun during solar flares and coronal mass ejections. Space Weather is how we refer to the variations in the local space environment driven by the expelled radiation and particles and how those variations impact the Earth and human society. Those impacts include: electronic failures in satellites; communication and navigation problems in airplanes; radiation hazards to astronauts; and loss of satellites to atmospheric drag. Electrical power to our homes and businesses can be interrupted by geomagnetic storms driven by blasts from the Sun. The importance of these variations will become apparent as we begin to understand how Space Weather works.
How can there be weather in a vacuum? Compared to Earth’s atmosphere, space is a very good vacuum, better than most vacuums we can create in the laboratory. Surface pressure is about 1013 mbar while the pressure 500 km (300 miles) above the surface is 3 × 10⁻⁹ mbar. Another example is the density of particles at different places. There are about 2 × 10¹⁹ (a 2 followed by 19 zeros) molecules in each cubic cm of the Earth’s atmosphere near sea level (a mass density of 1.2 kg per cubic meter). This should be compared to a density of 1 to 10 particles per cubic cm in the solar wind as it flows by the Earth.
Another important difference is that, unlike the atmosphere we live in, the tenuous gas in space is ionized. This means that some (or all) of the electrons have been stripped from the atoms, resulting in a gas of positively charged ions and negative electrons called a plasma. These charged particles are steered and accelerated by the magnetic fields that pervade the solar system. Most of the plasma comes from the solar wind that escapes the Sun's gravity and sweeps through the solar system at speeds from about 400 km/s (1.4 million km per hour) for a quiet Sun to 2000 km/s (7.2 million km per hour) during solar storms. At the same time the Sun's magnetic field is swept out through the entire solar system where it interacts with the magnetic fields of the Earth and other planets. Because the Sun rotates the Sun's magnetic field expands outwards in a spiral pattern, the Parker Spiral, with the charged particles of the solar wind spraying out into the solar system like a garden sprinkler.
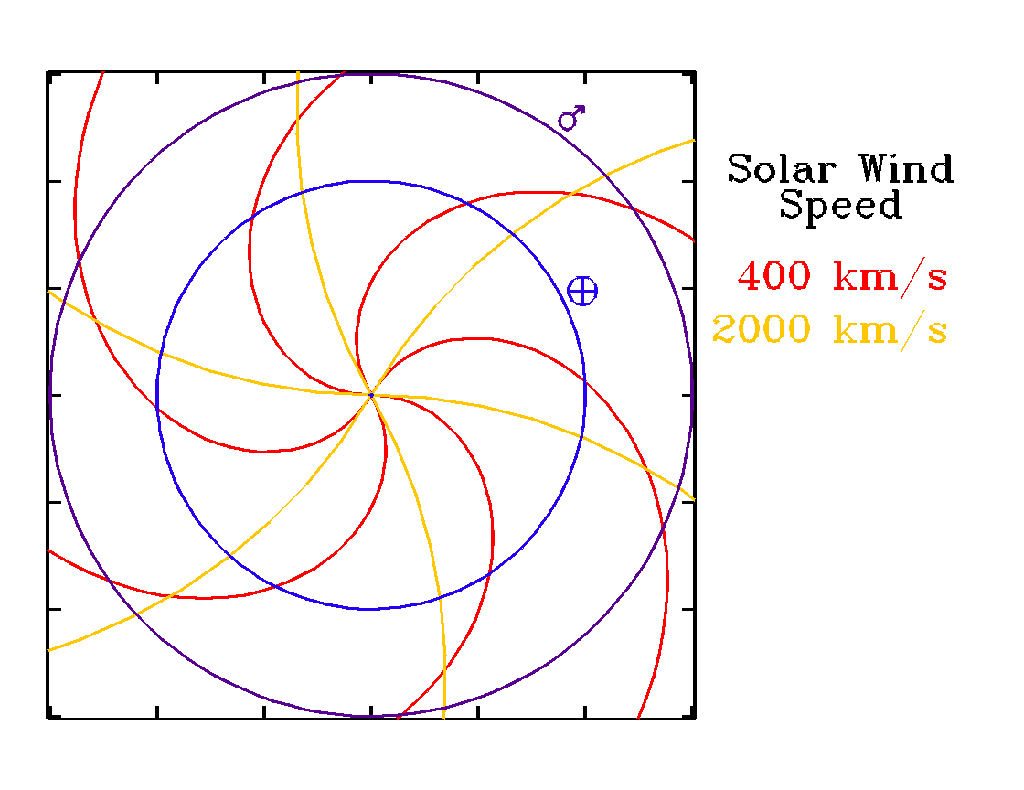
The Parker Spiral shows how the solar wind pulls the magnetic field into a spiral shape. The orbits of Earth and Mars are drawn to show how field from one part of the Sun can onteract with the field from another when the solar wind velocity of the two regions is different.
Sources of Space Weather
Unlike the water cycle of tropospheric weather, space weather is driven from the outside. Most sources of space weather change with solar activity, the 11-year rise and fall of sunspots on the Sun. Space Weather can cause changes in the space environment through events such as solar flares and Coronal Mass Ejections (CMEs) that occur on timescales of minutes to days or solar-cycle effects that occurs on timescales of 11-years or more.
The Solar Cycle
The 11-year sunspot or solar cycle is a rhythmic waxing and waning of the number of dark sunspots on the visible disk of the Sun. It comes from the "winding-up" of the solar magnetic field during which the magnetic field gradually decays and then finally undergoes a total magnetic reversal, which is when the magnetic poles flip. As the magnetic field becomes gradually more entwined towards solar maximum the surface fields of the Sun becomes more and more wrapped up. This increases the activity on the surface of the Sun, seen as sunspots (regions of highly complex and intense magnetic fields) and the more frequent occurrence of solar flares and coronal mass ejections.
The Sun is brighter at EUV and X-ray wavelengths during solar maximum then at solar minimum. This global brightening has Space Weather consequences. Impulsive events, such as coronal mass ejections, solar flares, or high speed streams in the solar wind, occur on timescales of minutes to hours, or even days. Delayed sources of space weather, such as geomagnetic storms, start after the solar signal that triggers the storm has passed the Earth and can last for days to weeks. Galactic cosmic rays are reduced by solar activity and have more rapid variations caused by CMEs. Interplanetary dust particles are a continuous source of easily-ionized meteoric material to the Earth. Impacts of asteroids and comets are infrequent, catastrophic events.
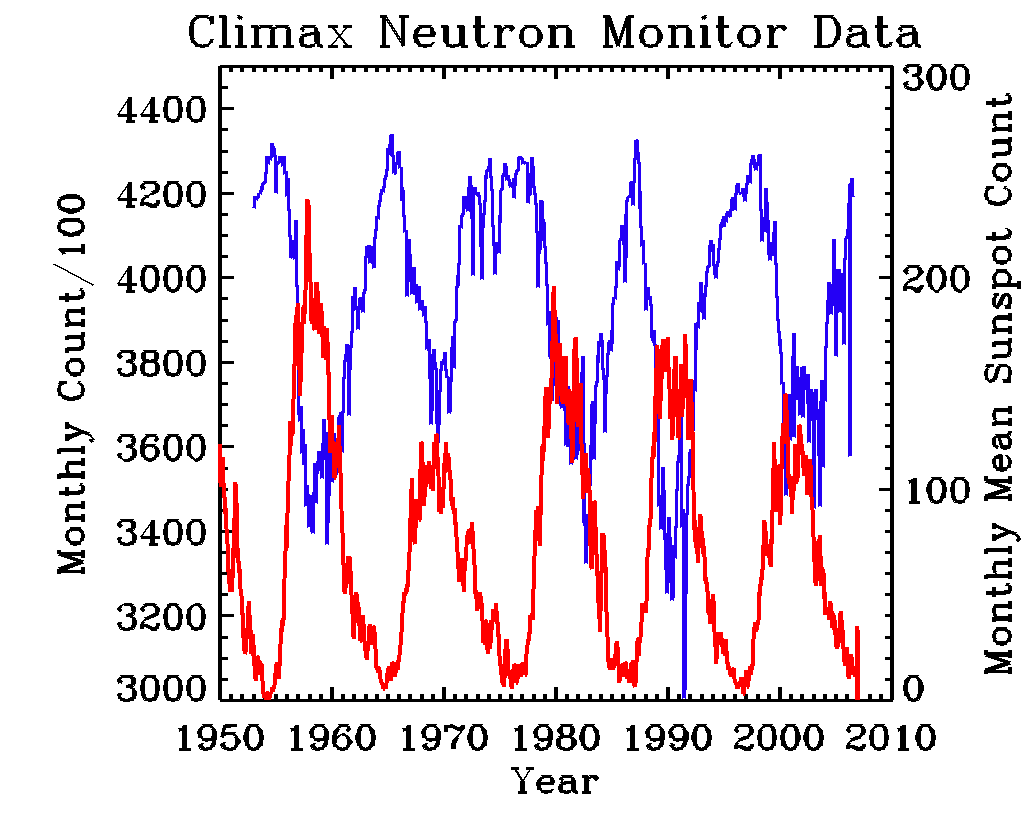
Our Sun's 11-year cycle of activity varies the amount of incoming Galactic Cosmic Radiation received here on Earth.
Coronal Mass Ejections
A Coronal Mass Ejection (CME) occurs when a prominence suspended above the surface of the Sun erupts and sends millions of tons of material into space. This cloud of charged particles is generally confined within a magnetic field (like a magnetic bubble), expanding and traveling out through the solar system at speeds from about 200 km/s up to a staggering 2000 km/s. When directed towards Earth a CME typically arrives 2-3 days after eruption but in exceptional cases can arrive in less than 24 hours. The ensuing activity in the local space environment can wreak havoc with technologies at Earth; from satellite failures to city-wide electrical black-outs. CMEs are spectacular events to watch, inset is an image of an event captured by the LASCO coronagraph on the SOHO satellite.
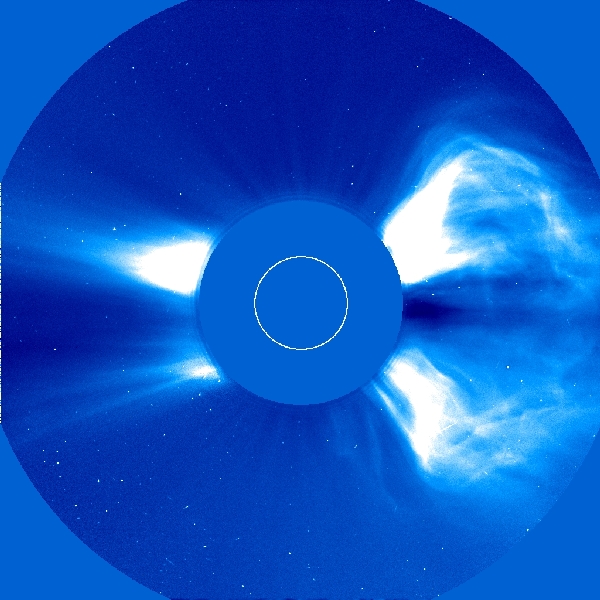
Large coronal mass ejection (CME) at 12:36 UT on 6 November 1997 as recorded by the LASCO C2 coronagraph on SOHO.
Solar Flares
A solar flare is a bright flash of X-rays seen during an energetic explosion in an active region of the Sun. It's usually seen as a large burst of X-rays, but may also have a coincident bright flash of white light. A flare lasts a matter of minutes but releases an immense amount of energy. During solar flares the Sun can be 1000 times brighter in X-rays than normal. Flare intensities are categorized by National Oceanic and Atmospheric Association's Space Weather Prediction Center (NOAA SWPC) based on the X-ray flux measured at Earth. Large X-ray flares can cause greatly enhanced levels of ionization of the Earth's ionosphere that can cause problems for radio communications as well as certain types of low-frequency navigation.
Solar Energetic Particle (SEP) Events
In some cases solar flares and CMEs can generate high fluxes of extremely high energy particles called Solar Energetic Particles (SEPs). These charged particles consist mainly of protons and electrons. They are thought to be accelerated either by solar flares above the surface of the Sun or by their interaction with CMEs as the particles travel through the solar system.
The energy of these particles ranges from a few MeV (a velocity 4.6% of the speed of light) to well over a 1 GeV (1000 MeV, or a velocity 87% of the speed of light). During an SEP event the most energetic particles arrive at Earth in only 15 to 30 minutes with the less energetic particles (10-100 MeV) arriving hours to days later. However, the most energetic particles usually subside more quickly too, remaining at elevated levels for only a few hours after the onset of an event. Particles with lower energies can remain at highly elevated fluxes for days after the event.
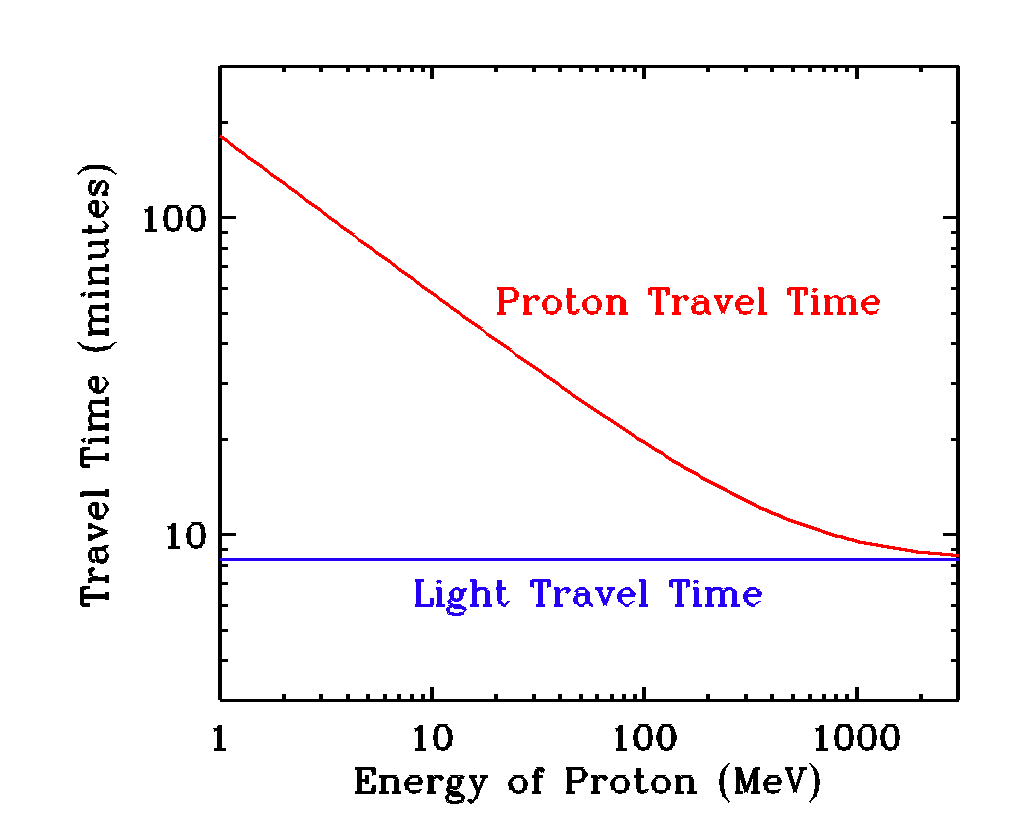
Travel times for protons leaving the Sun and moving in a straight line to the Earth. Light takes 8 1/2 minutes to travel from the Sun to the Earth. Protons with large energy can arrive almost as fast, but with lower energy the protons take much longer.
High Speed Streams in the Solar Wind
A high speed stream (HSS) is like a powerful gust in the solar wind. Near the edge of a HSS are regions of high particle density and strong magnetic fields while inside the stream the density and field are low and the temperature and velocity are high. The flow velocity inside a HSS can reach 300 to 1000 km/s. In some cases they will produce interplanetary shocks. High speed streams come from coronal holes, dark regions in the solar corona, and are most common during the declining phase of the solar cycle. High-speed streams can last a long time and we often see a HSS every 27 days as its home coronal hole rotates into the right position. Because coronal holes do not align with sunspots or active regions and could only be seen once coronal images from space were available, the origin of high speed streams was originally assigned to M-regions.
Geomagnetic Storms
The Earth's magnetosphere is a bubble created around us by our magnetic field that protects us from most of the particles the Sun throws at us. When a CME or high speed stream arrives at Earth it buffets the magnetosphere. If the arriving solar magnetic field is directed southward it interacts strongly with the oppositely oriented magnetic field of the Earth. The effect is the Earth's magnetic field is peeled open like an onion allowing energetic solar wind particles to stream down the field lines to hit the atmosphere over the poles. At the Earth's surface a magnetic storm is seen as an rapid drop in the Earth's magnetic field strength (typically a drop of 30 to 500 nT in 1-2 hours). This decrease lasts about 6 to 12 hours, after which the magnetic field gradually recovers over a period of several days.
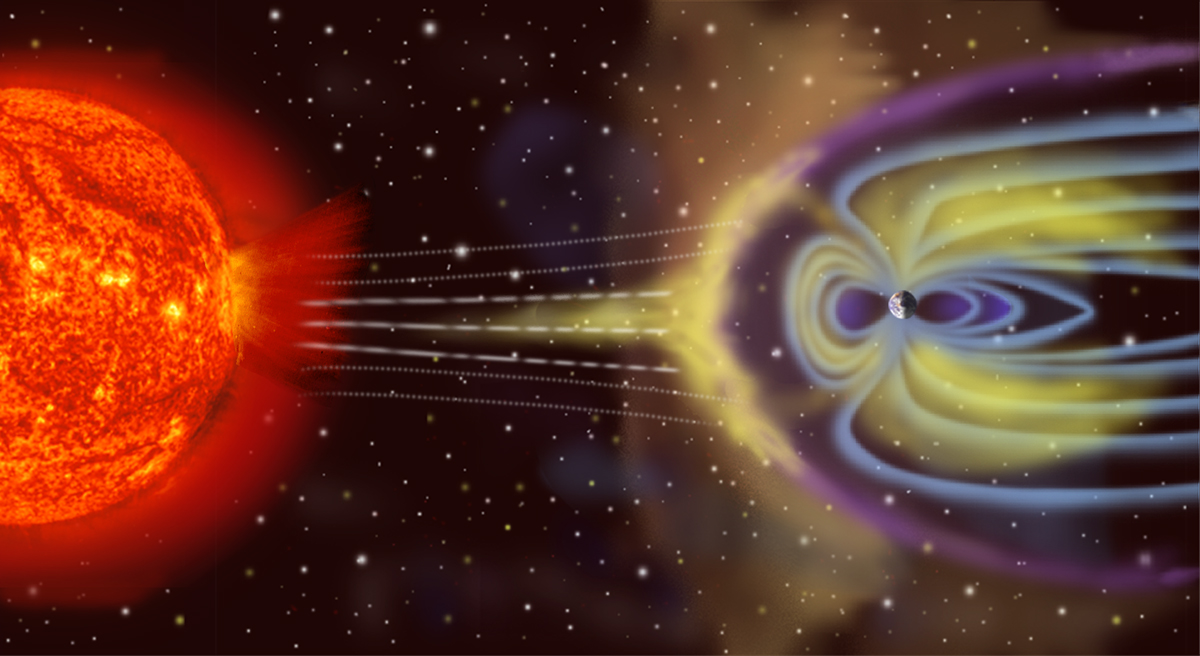
Geomagnetic storms are formed when a CMEs or high speed solar wind stream strikes the magnetosphere.
Galactic Cosmic Rays
A constant rain of Galactic Cosmic Rays (GCRs) passes through all of space. These charged particles are accelerated to extremely high energies by galactic events such as supernovae (the catastrophic collapse of a star) although some may come from outside the Milky Way. Their high energy allows GCRs to penetrate through the Earth's magnetosphere and deep into the atmosphere. As they enter the atmosphere they collide with molecules of oxygen and nitrogen and produce millions of tiny fragments. The GCR ionization rate (roughly the radiation dose) reaches a maximum at an altitude of about 12 km (40,000 ft) and then decreases towards the Earth's surface.
The intensity of the Galactic Cosmic Rays (GCR) at Earth is highest during solar minimum. This happens because the intense regions of magnetic field extending out from the Sun into the solar system during solar maximum divert the charged cosmic rays away from the solar system. As a result the GCR intensity at Earth during solar maximum is half the GCR intensity during solar minimum.
Interplanetary Dust Particles and Meteoroids
Ablation products from Interplanetary Dust Particles and Meteoroids (IDPs) create sporadic E on the Earth and long-lived ion layers on other planets. These layers can affect communications. The less compressed layers of meteoric ions may cause noctilucent clouds. There is also a danger of an impact on a satellite while in orbit. Orbital debris, small particles left in orbit by satellites, is one of the biggest hazards to satellites orbiting in low-Earth orbit (altitudes below 1000 km, which is below the radiation belts.) This includes the International Space Station.
Asteroids and Comets
Impacts of the larger minor bodies (asteroids and comets) are catastrophic events. Although the IDPs are a continuous source of meteoric material to the Earth, the larger impacts provide a similar annual mass flux. Thankfully that mass flux enters over millions of years—not everyday. A sufficiently large asteroid or comet can strip the Earth of its atmosphere. Although asteroids and comets are a source of space weather, they are too rare to discuss below.
Space Weather and Technology
Our infatuation with technology has continued unabated since the Stone Age. Some technologies, such as the plow, allow us to manipulate our physical world. Other, such as the printing press, are used to manipulate information. Few of those technologies are sensitive to Space Weather. Only when we use ephemeral electrical currents to manipulate our world and information or use satellites in space is interference from outside our world possible.
Our modern world provides many opportunities for interruptions caused by Space Weather. The heating and expansion of the thermosphere at solar maximum increases the drag on satellites, causing them to fall out of orbit. Energetic protons from the Sun can destroy equipment as well as injure aircrews and astronauts. Currents generated by Space Weather inputs can disrupt pipelines, power lines, and radio communications. Airlines fly polar routes to save time and money but space weather related radio outages may cause them to divert to more expensive routes.
Our use of technology has exploded since the effects of Space Weather on telegraphs were first noticed in 1848. Here we show a timeline of technology and sunspot number. The 11-year sunspot cycle was first noticed in 1843, before our technological world evolved. But each year sees more compact electronics in orbit and more dependence on orbiting satellites. Ever-larger energy requirements have created a need for greater interconnections on the ground. All are affected by the changes in the Sun over a solar cycle.

Sunspot Number and the Rise of Technology

Technologies & Space Weather
Effects of Space Weather
This figure shows some of the ways that modern technology can be affected by space weather. Some technology is in orbit, some on the ground. Some uses radio waves. All would like a warning before a disruption occurs. These effects are for systems near the Earth. As we travel further into space we will find that every planet will see its own version of Space Weather. For example, Mars has a small magnetic field and its magnetosphere is much less extensive than the Earth's. The effects of magnetic storms will be smaller at Mars. Venus is closer to the Sun than is Earth; does this increase the effects of solar flares? Trips between planets will require knowledge of the Sun's output along the orbit to and than at each planet on the trip. This means being able to predict flares on the far-side of the Sun!
In the sections below we will discuss how different technologies are affected by space weather. We will concentrate on satellites, astronauts, aircraft, communication & navigation systems, and powerlines & pipelines.

Technologies & Space Weather
EFFECTS ON SATELLITES

Solar storms can lead to outages in satellites and may cause a complete satellite failure. Solar storms can also increase the frictional drag on satellites in LEO, degrading their orbits and causing satellites to re-enter the Earth's atmosphere sooner than expected. As satellites orbit the Earth they absorb electrons from the ionosphere and magnetosphere as well as lose electrons when solar X-rays strike the surfaces. A spark may occur if a satellite has too many or too few electrons, destroying electronic parts.
Skylab re-entered the Earth's atmosphere several years early because Solar Cycle 21 was more active than had been anticipated.
X-rays degrade solar panels and are part of the charging problem. Solar cells convert solar photons into electrical energy. Flare X-rays can damage the solar cells, reducing their power output and aging a satellite. Electrons flow onto and off orbiting satellites. X-rays from a solar flare knock the electrons off satellites. If too much charge is removed a discharge can damage the satellite.
Atmospheric drag. The solar irradiance at FUV wavelengths between 122 and 200 nm creates atomic oxygen that flows up to form the thermosphere and ozone that flows down to form the ozone layer. The solar irradiance at X-ray & EUV wavelengths (between 1 and 122 nm) creates the ionosphere. When X-rays from a solar flare are absorbed in the atmosphere the thermosphere heats and expands, increasing the atmospheric density at the altitudes of low-Earth orbits. Higher density & temperature leads to more frictional drag.
Deep-Dielectric Charging and Single Event Upsets The energetic particles of an SEP event and those produced during a geomagnetic storm are among the most damaging radiation of SWx.
The radiation belts are a region of trapped energetic charged particles located inside the Earth's magnetosphere between altitudes of 6000 to 40,000 km. Unfortunately for satellite operators and users this is also a region where many satellites orbit. Large scale increases in the energy and flux of relativistic "killer" electrons in the Earth's radiation belts are an important space weather effect.
Often associated with magnetic storms, the high intensity of relativistic electrons cause deep-dielectric charging and single event upsets (SEUs) in electronic satellite components. Past relativistic electron flux enhancements have been blamed for damaging and sometimes for the complete failure of satellites. The Living With a Star RBSP mission will study the acceleration of these electrons.
Surface Charging and the Aurora Aurora are a beautiful manifestation of space weather. They are caused by the flow of magnetospheric electrons along field lines into the upper atmosphere. These energetic charged particles interact with oxygen and nitrogen molecules in the atmosphere causing them to emit the colorful red and green lights of the aurora. Electrons flowing along a field look like an electrical current to orbiting satellites. If the charge buildup caused by increased auroral electrons is not removed a dangerous spark can occur in the satellite.
Many small particles strike the Earth every day. They also strike satellites in orbit around the Earth. Most of these impacts cause minor damage and their impact craters are used to measure the number of hits. A more recent problem has been what happens after satellites fall apart in orbit. The remaining pieces are called orbital debris. The orbits of orbital debris is monitored so as to avoid collisions. Space weather increases the atmospheric drag on the debris, changing the orbits and making the tracking more difficult, but also removing the debris by causing them to re-enter the atmosphere.
 Some solar images from Skylab's soft x-ray telescope, S-056. This grazing incidence telescope produced images of the Sun in x-rays with wavelengths from 6 to 49 Å. Coronal holes are the dark regions where the hot coronal material is very thin. Coronal holes were observed to rotate fairly rigidly and maintain their shape through several 27-day solar rotations. A movie of these images can be seen at NASA Marshall Space Flight Center.
Even when flares are not occurring the Sun is brighter at X-ray and EUV wavelengths at solar maximum then at minimum. It is already known that changes in the energy output of the sun can affect the climate here on earth. During solar maximum, the peak of the 11-year cycle, the sun shines a tiny bit brighter (up to one half of a percent). Studies of tree-ring thickness show that plant growth follows the ups and downs of the solar cycle. Another example is a historical event called the Maunder Minimum, a 65-year dip in solar activity that caused a period of global cooling on earth in the late seventeenth century. During this time, known as the Little Ice Age, temperatures plunged and the Baltic Sea froze over regularly.
Scientists speculate that GCRs may also affect our climate. GCRs create ions (charged particles) as they are stopped in our atmosphere. Because ions act as "seeds" (nucleation centers) for clouds, GCRs may be involved with cloud formation in our atmosphere. The solar cycle modulation of GCRs would then become a solar cycle modulation of clouds, relating our climate to solar activity.
EFFECTS ON ASTRONAUTS
Radiation and high-energy particles from the sun can damage living tissue. Here on the ground, we are protected by the combined action of the magnetosphere and the atmosphere. Outside the protective atmosphere of the Earth astronauts are subject to much higher doses of radiation than they would otherwise normally receive. Space walks may be rescheduled or delayed due to the threat of a solar storm in order to keep astronauts within the protection of the Space Shuttle or other vehicle.
Impacts of Solar flares, CMEs, SEP events, High-speed Streams, Geomagnetic storms, and GCRs
All of these events increase the radiation dose to astronauts. The actual dose depends where the astronaut is orbiting. The Space Radiation Analysis Group at NASA's Johnson Space Center describes how NASA anticipates and protects the astronauts.
EFFECTS ON AIRCRAFT
Airlines are affected by space weather in a variety of ways. Aircrew on polar routes (latitude above 78°) are exposed to higher levels of radiation than at the surface. The solar storms can also effect aircraft avionics, communication, and GPS navigation systems. Flights at latitudes below 82° can use satellites to communicate with the ground, flights at higher latitudes must use HF radio communications. With the rapid increase of airplanes flying polar routes, concerns over HF communications outages have become a major limiter of the number of flights.
Forbush Decrease, a Reduction in GCRs by CMEs A Forbush Decrease (FD) is a reduction in the GCR intensity at the Earth's surface caused by the passage of a CME. The complex and enhanced magnetic field that expands out into the solar system during a CME scatters away the incoming GCRs. Ground level neutron monitors on Earth can measure a 30% decrease in the observed GCR intensity. The effect is more enhanced at higher latitudes (due to the shape of the magnetosphere.) Typically FDs last for several days, while the GCR intensity returns to normal background levels.
SEP events can increase the level of atmospheric radiation. Severe SEP events that cause an increase in radiation at ground level are known as Ground Level Events (GLEs). To produce a noticeable increase in radiation at ground level usually requires particles with energies greater than 100 MeV at the top of the atmosphere. The intensity of the event will ultimately depend on the higher energy range of the SEP spectrum.
The radiation dose you receive from a SEP event depends your altitude, your magnetic latitude, and on the energy of the solar particles. When you move to higher altitude you have less shielding from the atmosphere, increasing your dose. When you move to higher latitudes (towards the polar regions) the protection provided by the Earth's magnetic field becomes less, also increasing your dose. During SEP events the risk of increased radiation exposure is highest during the first few hours while the most energetic of the SEPs arrive at Earth. However, the intensity of these particles quickly decreases and the danger is reduced. It should be noted however, that many SEP events coincide with CMEs which often result in a Forbush Decrease, an overall decrease in the background cosmic ray intensity. This decrease in the background GCR intensity may more than compensate for the increase in radiation due to the SEPs. Therefore many factors must be taken into account when assessing the increase in radiation dose due to SEP events.
Increased Galactic Cosmic Ray Intensity Like SEP events, the radiation dose you receive GCRs depends your magnetic latitude and altitude. The protection provided by the Earth's magnetic field becomes less as you move towards the polar regions (higher latitudes). As you move to higher altitude you receive less shielding from the atmosphere, again increasing your GCR dose. During solar minimum the solar magnetic field is smaller and less contorted, allowing more GCRs into the solar system and increasing the radiation dose. The intensity of GCRs decreases as solar activity increases.
EFFECTS ON NAVIGATION AND COMMUNICATIONS
The telegraph was the first man-made system to use long electrical conductors and consequently was the first system to be affected by magnetic disturbances. Many accounts of the telegraph system being unusable when aurora were observed overhead are available. There are even accounts of telegraph engineers using the "celestial power" associated with the aurora to send messages.
In the 20th century the technology of cable communications changed but the cables continue to be affected by the voltages induced by geomagnetic disturbances. New submarine cables use optical fibers to carry the signals, but a conductor is still used in the cable to carry power to the repeaters. At the time of the March 1989 storm, a new transatlantic telecommunications fiber-optic cable was in use. It did not experience a disruption, but large induced voltages were observed on the power supply wires. Future cables, because of improvements in the fiber optics, may use fewer repeaters and require a lower driving voltage. However, downsizing the power feed equipment without taking account of the induced voltages may leave future systems more vulnerable to geomagnetic disturbances.
Navigation and communication systems that use radio waves reflecting from or propagating through the ionosphere are vulnerable to several space weather effects that can degrade performance. In particular, systems such as the Global Positioning System (GPS), that use constellations of earth-orbiting satellites, are affected by space weather phenomena. In principle, the GPS uses known positions of satellites and their distances from a receiver to determine the location of the receiver.
Recent research has shown that bursts of energy from the sun can disrupt mobile phone communications, causing conversations either to be covered with noise or calls to be dropped.
HF Communication Degradation. High Frequency (HF) radio signals use frequencies around 30 MHz that pass through the ionospheric D-region (at ~80 km) but are reflected by the F-region (at ~300 km). You can use the reflection to increase the range of the signal by bouncing it off the ionosphere (called skip). Large X-ray fluxes during a solar flare increase the ionization of the D-region resulting in increased absorption of the radio signal. The reduced signal strength can cause degradation of the radio communications. This can be partially mitigated by increasing the frequency but this only works until the signal also passes through the F-region at which point any communication relying on skip is completely lost.
Energetic particles from SEP events, CMEs, and high-speed streams enter the upper atmosphere near the magnetic poles. As a result, the lower levels of the polar ionosphere become more ionized, with severe absorption of HF and VHF (100 MHz) radio signals. Such an event is known as a polar cap absorption (PCA) event and may last from days to weeks, depending on the strength of the stream of solar particles and the location of the source region on the Sun. HF radio communication in polar regions is often impossible during PCA events.
These HF communication dropouts are the most important SWx problem for airline pilots.
HF Communication Degradation. The ionosphere's F region can become depleted of electrons during magnetic storms, degrading HF radio communications. Unlike the flare effect, this communications problem comes from the removal of the reflecting layer.
Scintillations cause GPS dropouts and navigation errors A GPS receiver uses radio signals from several orbiting satellites to determine the range, or distance, from each satellite, and uses those ranges to determine the position of the receiver. Because the radio signals must pass through the ionosphere, they are affected by the variations in the electron density of the ionosphere. Changes in the electron density due to space weather can change the speed at which the radio waves travel, introducing a propagation delay in the GPS signal. The propagation delay can vary from minute to minute, and such intervals of rapid change can last for several hours, especially in the polar and auroral regions. Changing propagation delays cause errors in the determination of the range.
- Scintillations are small fluctuations in the electron density. They deflect the radio waves moving from the satellite to your receiver. Much like a stick stuck in water appears bent when you look near the surface (even though the stick is still straight) this deflection causes your receiver to misjudge the location of the GPS transmitter.
- Position errors for single frequency GPS can range to the tens of meters, while dual frequency or differential GPS can reduce these errors to 1-2 meters. These GPS errors can be both horizontal and vertical in nature.
Magnetospheric electric fields cause GPS dropouts and navigation errors During a magnetic storms large electric fields are generated in the magnetosphere that move the electrons and ions in the ionosphere. The new pattern of ionization affects the GPS radio signals and causes navigation errors. This effect is seen over the USA, unlike other SWx effects that are primarily over the poles and equator.
EFFECTS ON POWERLINES AND PIPELINES
Our power grid becomes more complex and interconnected every year. This allows electricity to be transferred from producers to consumers over large distances. Electricity cannot be stored and this ease of transfer is very important. But we also have become more dependent on power generation far from our homes and businesses. If space weather disrupts the power transmission grid the disruption can cascade through a large area of the energy grid. Large (Quebec, Canada, March 1989) and small (Malmö, Sweden, October 2003) outages have been caused by space weather.
Electricity is a unique commodity because it cannot be easily stored, it must used soon after it is generated. Pipelines transfer material that can be stored at both ends of the pipe. Failures of the electrical grid can lead to instabilities and a collapse of the grid. Failures of pipelines lead to a mess but are a problem only for the customers of that pipeline.
Powerlines. One of the most dramatic effects on ground systems during geomagnetic storms is the disruption of power systems. Ionospheric currents can reach tens of thousands of amperes during a geomagnetic storm, producing fluctuations in the Earth's magnetic field. Such disturbances can generate low-frequency (DC) ground induced currents (GICs) in long power lines that can overload transformers and cause power outages. For instance, during the March 13, 1989, storm, GICs caused a complete shutdown of the Hydro-Quebec power grid resulting in a nine-hour power outage for 6 million people. The power pools that served the entire northeastern United States came uncomfortably close to a cascading system collapse. With warning from space weather forecasters, power companies can take steps to minimize failures.
Pipelines. Just like wires, the pipelines that carry oil and other materials are made of conducting material. Geomagnetic storms can also induce electric currents in these pipelines. Where pipelines pass through rock that doesn't conduct electricity well (such as igneous rocks) the currents follow the path of least resistance and become concentrated in man-made conductors like pipelines. The currents flow between the Earth and the pipeline causing increased corrosion of the pipeline.
Radiation Dose
WHAT IS YOUR RADIATION DOSE IN A POLAR ROUTE?
If you live in the USA you receive an annual radiation dose of about 3000 µSv or 3 mSv. This includes a dose of about 100 µSv (10 mrem) from every chest X-ray. (These estimates are from a table at the The Radiological Society of North America). About 10% of your total annual background radiation dose is due to GCRs. When looking at information about radiation doses you should remember that 1 mrem = 10 µSv, and that mrem and µSv combine the radiation dose with its effectiveness in a human body. Other measures of radiation effects, such as the rad and Gray (Gy), describe only the amount of radiation energy absorbed (not how it affects your body). Doses of X-rays, cosmic rays, and energetic protons can be easily compared by reporting the doses in µSv.
When you travel in a jet airliner at 37,000 ft you are flying above about 80% of our atmosphere. This means the shielding of the atmosphere is reduced and you will get a small dose of radiation from the galactic cosmic rays and energetic solar particles during your flight.
The CARI-6 program was developed by the FAA's Civil Aerospace Medical Institute to calculate the radiation dose from galactic cosmic rays for a passenger flying along a great circle between any two airports in the world. The program is available as a DOS .exe file and uses a menu driven user interface.
To help you use the program, we provide several examples below. You must specify the airports where you start and finish, the altitudes, and the time spent at each altitude. The CARI program identifies airports by their 4-letter ICAO codenames, not the 3-letter IATA airport codes used on your airline tickets, although the ICAO codes are becoming more common. Both abbreviations are listed in the table.
To make life simple the great circle distance was calculated and the time in flight found by assuming a constant velocity of 500 mi/hr. The ascent and descent times were one minute each, and the altitude was set to 37,000 ft. I looked at four flights, two that stay at mid-latitudes, one polar and one trans-equatorial. The GCR flux changes with solar activity, so I calculated doses for July 2000 (solar maximum) and July 2006 (solar minimum conditions). These dose calculations are somewhat crude as the flight profiles are very simple.
Airports Used to Create Doses
| Airport | CODE | ICAO | Latitude | Longitude |
|---|---|---|---|---|
| Baltimore-Washington International | BWI | KBWI | 39.20 | 76.39 W |
| Beijing International | PEK | ZBAA | 39.55 | 116.23 E |
| Chicago O’Hare Airport | ORD | KORD | 41.49 | 87.37 W |
| London Heathrow Airport | LHR | EGGL | 51.3 | 0.07 W |
| San Francisco International Airport | SFO | KSFO | 37.45 | 122.26 W |
| Sydney International Airport | SYD | YSSY | -33.55 | 151.7 E |
CARI-6 Doses for Several Flights
| Start | Finish | Distance | Time Aloft | Dose (µSv) | |
|---|---|---|---|---|---|
| (miles) | (minutes) | July 2000 | July 2006 | ||
| BWI | SFO | 2400 | 300 | 25 | 32 |
| O'Hare | Beijing | 6630 | 810 | 70 | 100 |
| BWI | Heathrow | 3630 | 435 | 38 | 53 |
| SFO | Sydney | 7400 | 900 | 45 | 48 |
From the table we can see that doses during July 2006 (solar minimum) are greater than during July 2000 (solar maximum). This is because solar activity diverts the galactic cosmic rays away from our solar system. When solar activity is lower the GCR dose increases. Your dose is determined by your time aloft (look at ratios of Time Aloft and Dose). The largest dose is from the polar route. Even though the San Francisco-Sydney trip is longer, it crosses the equator, where the magnetic field screens the cosmic rays more effectively and reduces the dose.
In the polar regions energetic particles from the Sun can penetrate to the altitudes airplanes fly. The particles must be quite energetic and the Sun and Earth correctly aligned for this to happen. About one of these Ground Level Events (GLEs) happens each year (69 events since 1942), with more at solar maximum. A list GLEs from 1942-2005 is available at the Bartol Research Institute. No additional radiation dose due to the solar energetic particles was measured on a specially instrumented jet airplane flying polar routes.
PREDICTING SPACE WEATHER
Predictions of Space Weather are reported by NOAA's Space Weather Prediction Center (SWPC). The intensities of solar and geomagnetic storms are reported using the SWPC's Space Weather Scales. One use of these scales would be to not fly polar routes if the Space Weather Scale for Radio Blackouts was R 3 or higher. We also try to predict the space weather next month and next year, but that effort is only beginning.
Data and models from Living With a Star research will allow us to build accurate, data-assimilation models of the Earth’s radiation belts, thermosphere and ionosphere. Users of space weather data would like a picture of today's particle environment and ionosphere to allow them to anticipate radiation doses, radio outages and GPS navigation errors. Data from the Radiation Belt Storm Probes, due to be launched in 2012, will provide the data to make predictive models of the radiation belts that affect many satellites. The ITSP mission will study the effects of space weather in the mid-latitude thermosphere and ionosphere.
Physicists can predict these events by monitoring the conditions in the solar wind from satellites such as ACE. Conditions that are likely to lead to a magnetic storm are a high solar wind speeds (> 500 km/s) and a southward oriented interplanetary magnetic field (Bz~ –10 nT). (The interplanetary magnetic field comes from the Sun and is carried out through the solar system by the solar wind.)
Although missions such as SOHO and TRACE have taught us much about the solar influences on space weather, we still do not fully understand all sources of space weather nor can we reliably predict energetic particle eruptions or solar wind variations. Likewise, although we have learned much about the structure and dynamics of the solar interior and the evolution of active region magnetic fields, we still don't understand the solar dynamo and can't reliably predict the size of the next solar cycle or the emergence of the next active region. The understanding of the mechanisms of solar variability that we have gained from previous missions, ground-based observations, and theoretical studies leads us to additional questions that require new observations.
The strength of the magnetic field of the Earth is getting smaller with each passing day. How will this affect the interaction of Space Weather and our world of technology?
Space Weather FAQ
When questions about Space Weather are sent to SDO scientists we enter them into our FAQ. Please check the FAQ to see if your question has already been asked.
What causes space weather and where do space storms occur?
Space weather starts at the Sun when a flare (a brightening of the Sun) occurs or a CME lifts off the surface. When the energy from either a flare or CME gets near the Earth it affects the upper atmosphere of the Earth (disrupting radio communication) and brings energetic particles into our environment. The particles can injure astronauts but they also damage spacecraft and disrupt power lines and pipelines on Earth
How long do they usually last?
The solar storms last only a few minutes to several hours but the affects of geomagnetic storms can linger in the magnetosphere and atmosphere for days to weeks.
How long have we known about space weather?
Space Weather is a new term that combines several research fields. Disruptions of the telegraph system by solar storms was seen in the mid-1800's. Radio operators knew that the Sun interfered with radio waves soon after radio was invented in the early 1900's. Problems (such as outages and loss of data) related to space weather were seen in weather satellites when they began operating in the 1960's. All of these problems come from the same source (solar activity) and space weather was invented to group the causes and effects into one subject.
Who discovered SWx?
I don't know that a single person discovered space weather, but Lou Lanzerotti has been very active in saying we should think of space weather.
How do we feel the effects of space weather?
We see the effects of space weather when our radios don't work, GPS navigation is not as accurate as we like, when the power lines fail, and when spacecraft are damaged. There are no direct effects on humans at the surface of the Earth.
Does something shoot off the Sun during a solar storm?
Yes, either bright ultraviolet light from a flare or protons & electrons from a CME are shot off the Sun during a solar storm.
Can astronauts get hurt if they are in space while a space storm is going on?
Yes, astronauts can be injured by the particles that leave the Sun. However, their spacesuits and spaceships absorb most of the harmful radiation. Small rooms with thicker walls will be used as shelters on interplanetary spaceships and at the surfaces of the Moon and Mars when the radiation is predicted to be at dangerous levels. Please visit the Space Radiation Analysis Group at NASA's Johnson Space Center to see how NASA anticipates and protects the astronauts.
Would it effect astronauts as much if they were further away from the sun?
The effects when astronauts are farther from the Sun depend on what part of Space Weather you examine. The damage by flares and CMEs tends to weaken as you move away from the Sun. Once you leave Earth orbit the most dangerous energetic particles are galactic cosmic rays.
Can you forecast space weather?
We try to predict when an active region could produce a flare or CME. We also try to predict when geomagnetic storms will affect the Earth. A website where these predictions are shown is at NOAA's Space Weather Prediction Center (SWPC). We also try to predict the space weather next month and next year, but that effort is only beginning.