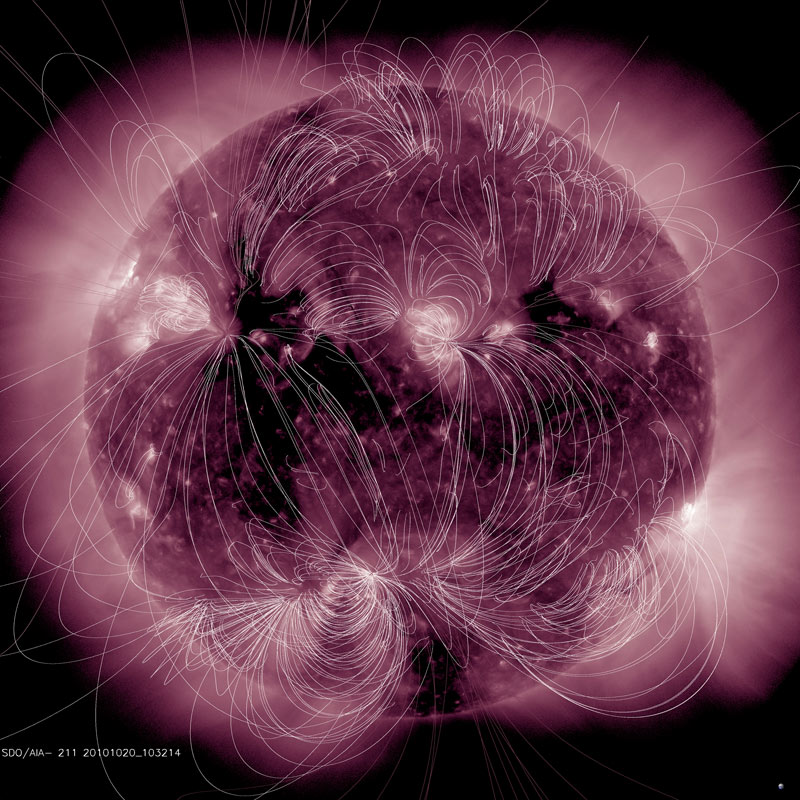
Magnetic Field Lines Galore 

The illustration maps the magnetic field lines emanating from the Sun and their interactions superimposed on an extreme ultraviolet image from SDO (Oct. 20, 2010). As one can see, the field lines are most dense around active regions, but they also link to other magnetically active areas across the Sun. These magnetic field maps are a recently added feature to the SDO site. Images for every wavelength each day can be found under “view latest images†link on the home page under The Sun Now image. These images are labeled PFSS and are available in different sizes. The movie shows the magnetic map overlaid on three extreme ultraviolet images and one magnetogram image (showing magnetically active areas as black or white).
Search Tag(s): 211, active regions
Movies
- PFSS_1024.mov - mov
- PFSS2_512.mov - mov
- PFSS.mpg - mpeg